RÍOS // CHAPTER N.1

RIVERS // AMAZONIA geo-linguistics - 2022
Visit: https://rivers.ulara.org
As you read these lines, the Amazon Rainforest continues to burn. In August 2018, news of the wildfires spread rapidly across social media platforms. Hashtags such as #wildfires, #AmazonFires, and #SaveTheAmazons trended for no more than seven days before being overshadowed by other topics. Since the fires began, nearly one million hectares of high-biodiversity forests have been lost, with almost 20% of the Amazon Rainforest already devastated. Reports from the National Institute for Space Research (INPE) show that deforestation in the Brazilian Amazon in the first seven months of 2022 increased by 278%¹.
Experts estimate it could take 200 years for these forests to regenerate.
While recent data from INPE indicates that deforestation rates have dropped by 30.6% in 2024—reaching a nine-year low²—wildfires have surged to record levels. September 2024 saw 41,463 fire hotspots, the highest for that month in nearly 14 years³. The ongoing fires, exacerbated by extreme drought conditions, have already burned over 26,000 square kilometres this year, nearly double the area affected in the previous year⁴. Scientists warn that climate change and human-driven land clearing are fueling this crisis⁵.
Rivers // Amazonia Geo-linguistics is an experimental research tool that once mapped information related to the Amazon Rainforest on Twitter. The online application explored social media semantics and its potential to identify socioeconomic, political, and environmental issues. It was designed to facilitate the analysis and visualisation of Twitter data, including hashtags and co-occurrences, archiving this data in a database and using algorithms to generate statistical insights. By analysing the language used in tweets, the tool provided a window into how Western societies perceived and engaged with the complex realities of the Amazon Basin.
The results of this analysis are applied to the geo-referenced marks where socio-environmental threads have been identified, performing experimental interventions on the actual topographic data of the Amazonian territory. These interventions result in the sculptures proposed in CHAPTER #2: HYBRID CARTOGRAPHIES
A touchscreen allows viewers to explore the archived data collected before Elon Musk acquired Twitter, rebranded it as X, and placed previously free data access behind a paywall—effectively disabling the tool's ability to update in real time.
Sources:
¹ National Institute for Space Research (INPE), "Deforestation in the Brazilian Amazon increased by 278% in the first seven months of 2022."
² Le Monde, Deforestation of the Amazon at a Nine-Year Low, 9 Nov 2024. LINK
³ Reuters, Fires in Brazil's Amazon Rainforest Surge for Third Month, 1 Oct 2024. LINK
⁴ Reuters, Brazil Fire Brigades Fight Amazon Blazes Off to Torrid Start, 9 Aug 2024. LINK
⁵ Associated Press, Criminals May Be Leveraging Climate Change as Record Acreage Burns in Brazil's Amazon, 2024. LINK
Methodology
The starting point of the tool Rivers // Amazonia Geo-linguistics was a carefully selected collection of hashtags related to Amazonia. Based on that initial list of hashtags, we started a database that collects all the hashtags occurrences that appeared in Twitter messages.
For example, #Amazonía is used in the following Tweet, published by AMAZON_NATION on the 23-11-2020:
Territorios Indígenas de la cuenca Amazónica. RÍOS // geo-linguistics // geo-politics // Amazonía work in process #doyourpartfortheamazon #amazonsnations #territorio #amazonia #rios #geopolíticas #mediart #installation #3d #map #mapping #geography
The hashtags present in the Twitter message are included in our database:
- #doyourpartfortheamazon
- #amazonsnations
- #territorio
- #amazonia
- #rios
- #geopolítica
- #mediart
- #installation
- #3d
- #map
- #mapping
- #geography
Now, these hashtags are part of the database. The application scans Twitter every 30 min. On May 2020 we initiated the database, with an amount of 255 hashtags. Today on January 2021, our database includes 650950 hashtags.
Currently, we perform weekly manual revisions to remove as much noise/irrelevant hashtags from the database. In future development, we will implement machine-learning algorithms that help us maintain an even healthier database.
The database stores the following information:
- Twitter messages
- List of hashtags
- Co-relations between hashtags
- Dates of each Twitter message
- Dates for each hashtag use
- Authors
- Number of times a hashtag has been used
Users can search for hashtags by introducing a word in the search engine, for example, #deforestation
Users can also use the predefined searches, on top of the page.
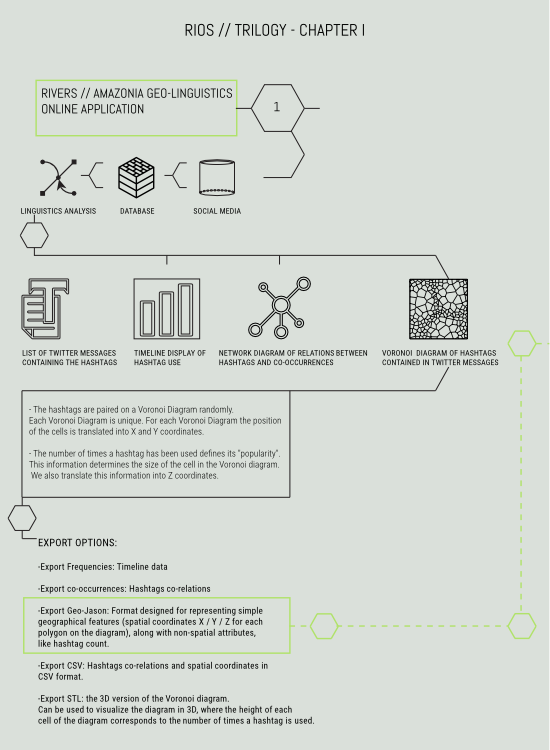
The search results are displayed on the following panels:
- Twitter message list: List of messages including the hashtags
- Timeline: Timeline displaying the hashtag used by dates and popularity
- Network diagram (co-occurrece): The network diagram visualizes which hashtags are often used together in tweets by drawing connections between those hashtags and forming clusters.
- Voronoi diagram (vocabulary): The Voronoi (vocabulary) diagram is based on the Voronoi algorithm. This algorithm allows the partition of a plane into regions close to each of a given set of objects. These objects are just points in the plane (called seeds, sites, or generators). For each seed, there is a corresponding region. These regions are called Voronoi cells. Each seed is a hashtag containing information that will define: the size, shape and position of the Voronoi diagram cells.
- The hashtags are paired on a Voronoi Diagram randomly. Each Voronoi graph is unique. For each Voronoi Diagram the position of the cells is translated into X and Y coordinates.
- The number of times a hashtag has been used defines its "popularity". This information determines the size of the cell in the Voronoi diagram. We also translate this information into Z coordinates.
The Voronoi diagram has a series of extra features that we use to create visual interventions onto the geo-referenced marks where socio-environmental threads have been identified, performing experimental interventions on the actual topographic data of the Amazonian territory.
These interventions result in the sculptures proposed in Chapter II: Ríos.
The Voronoi diagram performs the following features:
- Graphic size
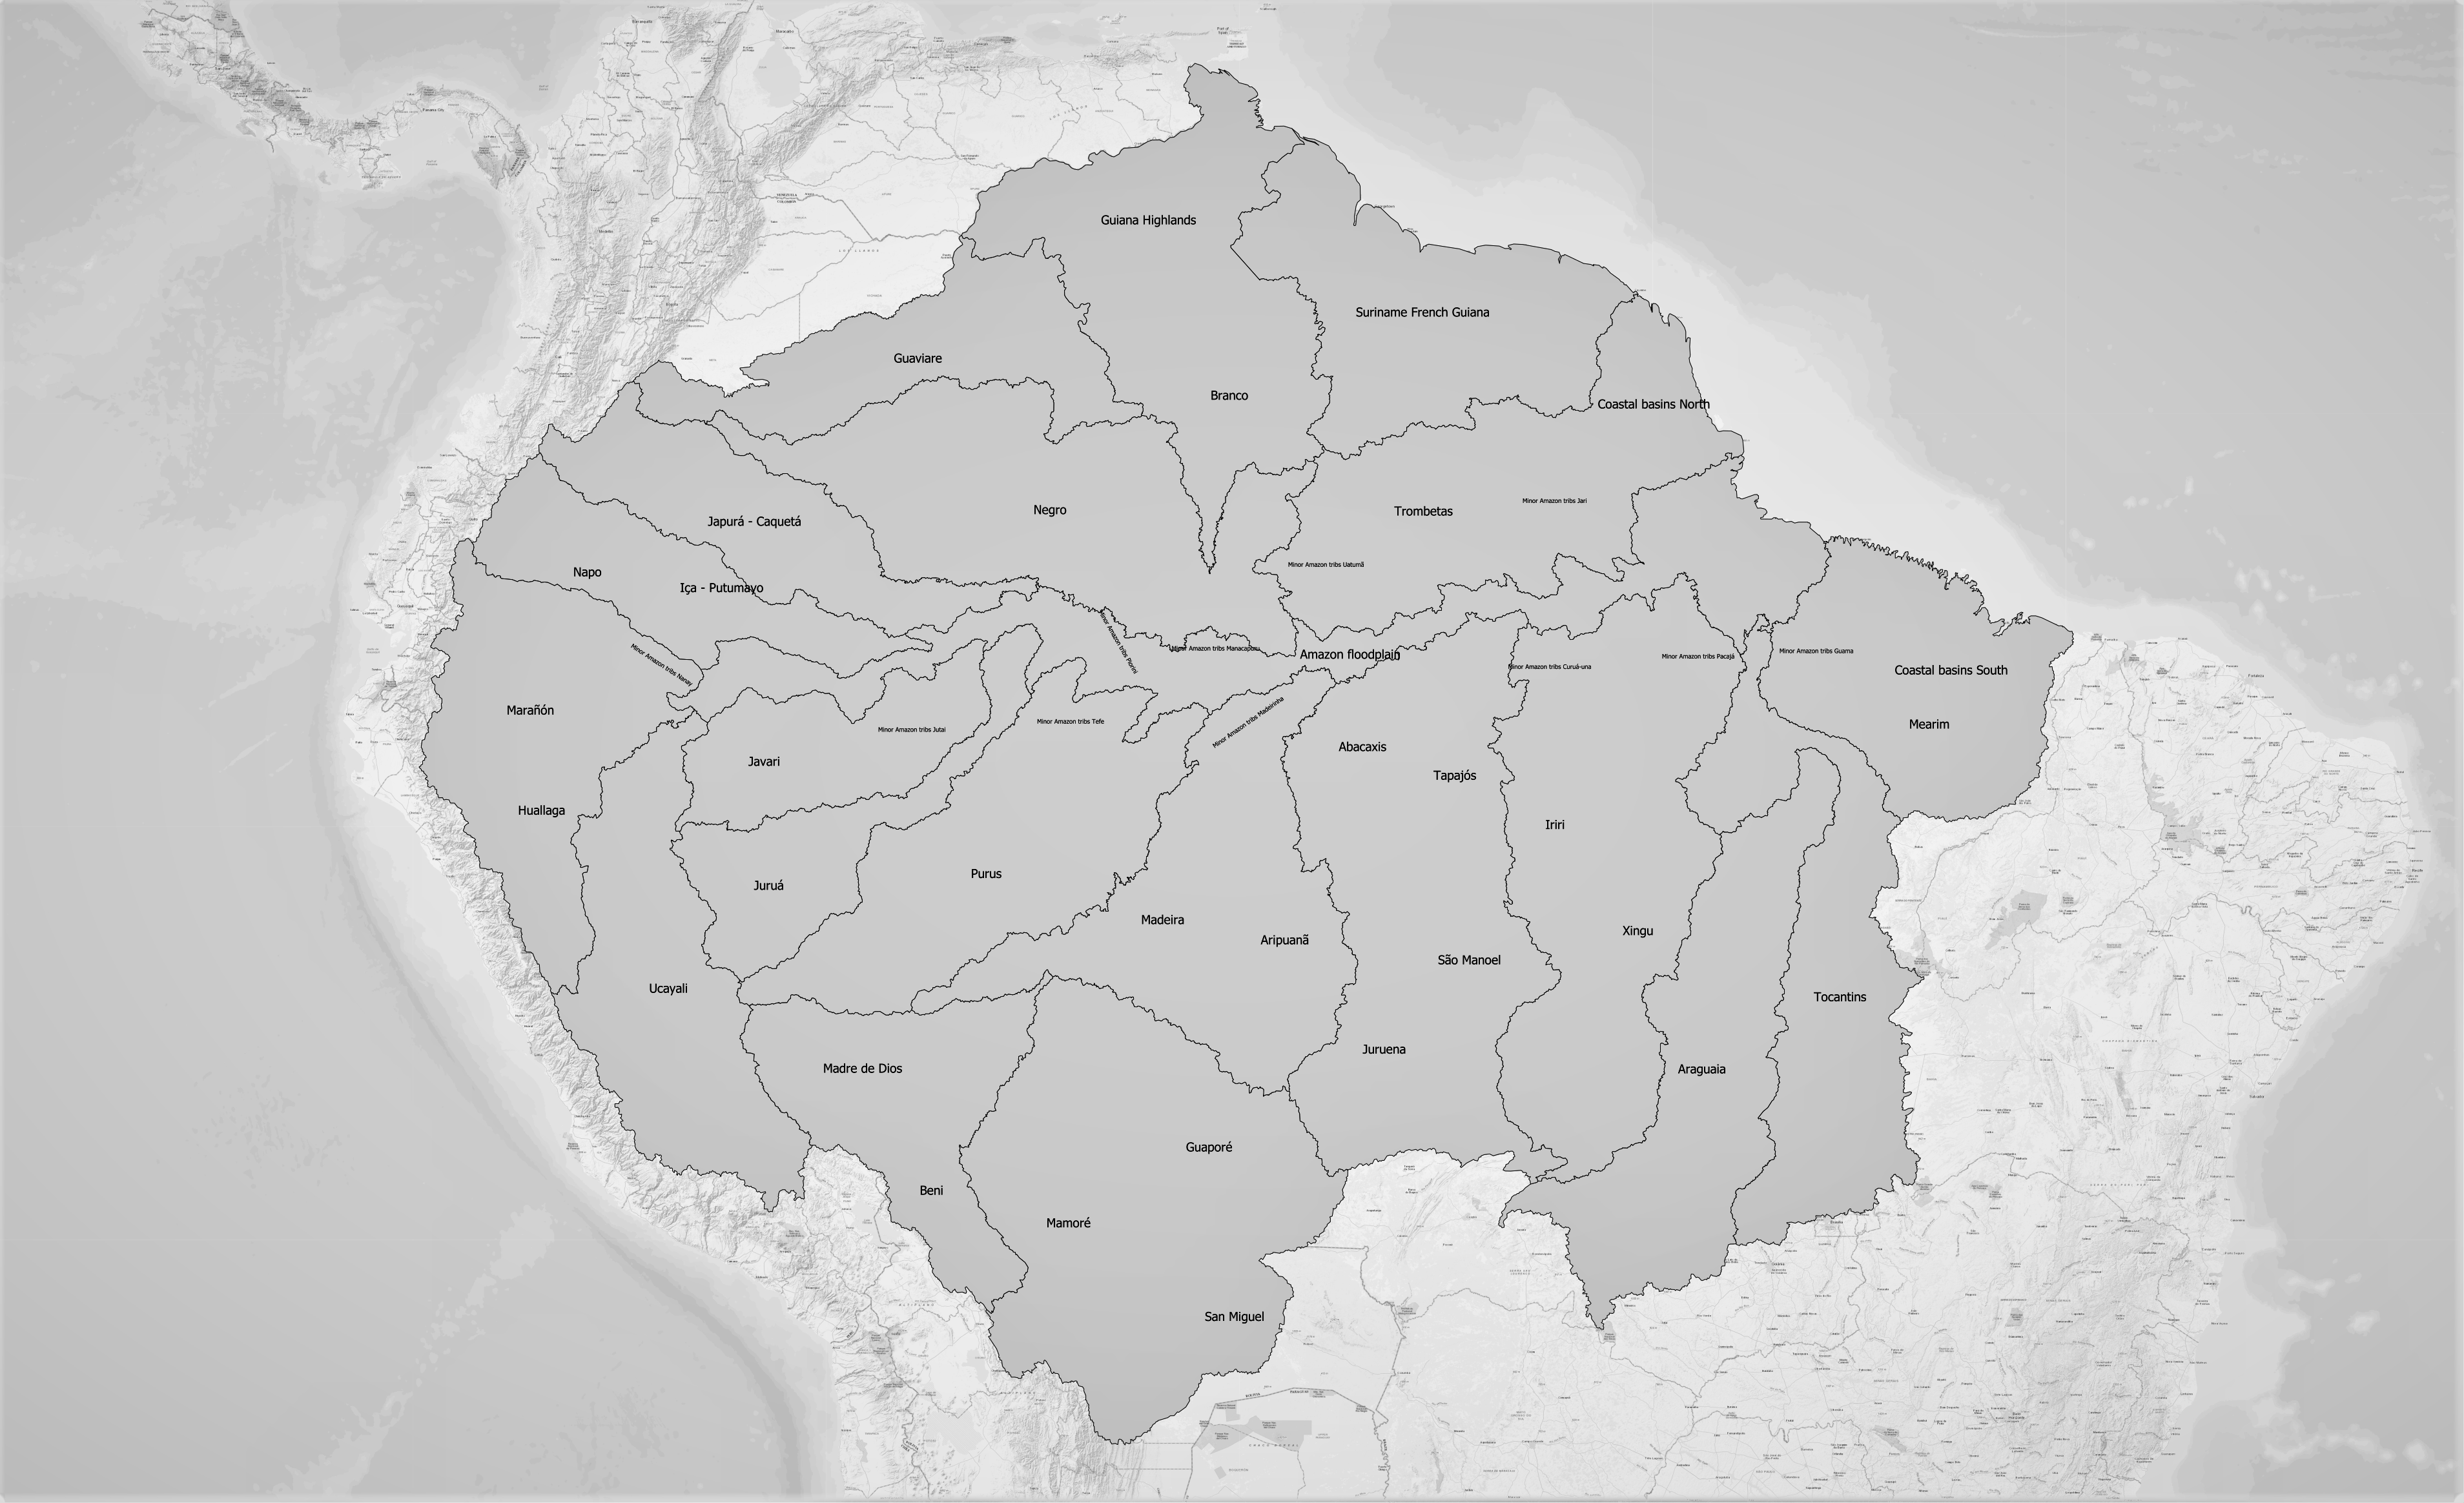
- Clip path functions: Each name corresponds to a sub-basin Amazonia.
Next to the clip-path function, there is an arrow icon that allows exporting the current Voronoi diagram in various formats:
- Export Frequencies: Timeline data
- Export co-occurrences: Hashtags co-relations
- Export Geo-Jason: Format designed for representing simple geographical features (spatial coordinates X / Y / Z for each polygon on the diagram), along with non-spatial attributes, like hashtag count.
- Export CSV: Hashtags co-relations and spatial coordinates in CSV format.
- Export STL: the 3D version of the Voronoi diagram. Can be used to visualize the diagram in 3D, where each cell's height corresponds to the number of times a hashtag is used.
Credits
- Conception, direction, production, Laura Colmenares Guerra
- Rivers//Amazonia geo-linguistics software, in collaboration with Gijs de Heij
- GIS analyst, Gabriel Codreanu